The major Periodic trends in periodic table are;
- Valency trend
- Atomic radius trend
- Metallic character trend
- Non Metallic character trend
- Electronegativity trend
- Electron affinity trend
- Ionization energy trend
Now, let me explain all these trends in a very very simple way, so that you can easily remember all these periodic trends.
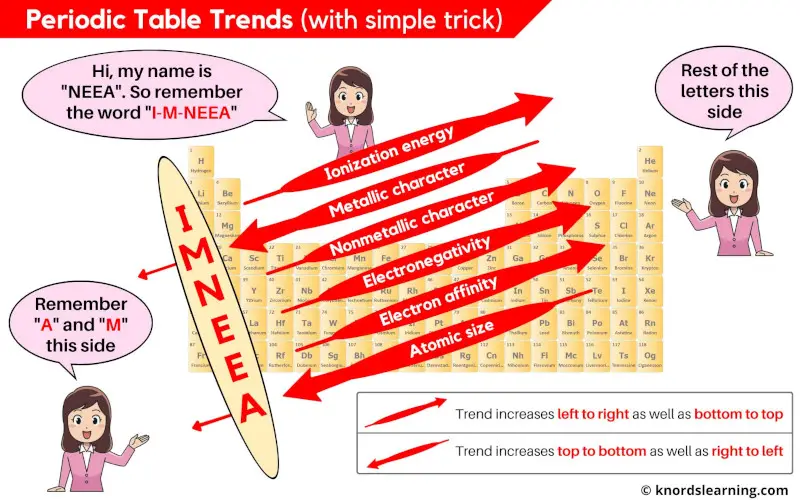
This single image is enough for you to remember all the major periodic trends of the periodic table.
Let me explain the above image in simple words.
Imagine a girl named Neea. So you have to remember the word “I M NEEA”.
Where;
I = Ionization energy
M = Metallic character
N = Non metallic character
E = Electronegativity
E = Electron affinity
A = Atomic radius
From this word (i.e I M NEEA), simply remember that A and M are towards the left side, and the rest of the other letters are towards the right side (see the above image).
Red arrow which is facing towards the top-right corner indicates that…
Bottom to top: property of elements increases, and also
Left to right: property of elements increases.
For example,
Ionization energy trend shows the arrow towards top-right corner, that means ionization energy increases from bottom to top and it also increases from left to right.
Red arrow which is facing towards the bottom-left corner indicates that…
Top to bottom: property of elements increases, and also
Right to left: property of elements increases.
For example,
Metallic character trend shows the arrow towards bottom-left corner, that means metallic character increases from top to bottom and it also increases from right to left.
So this is just a simple trick by which you can remember all the trends in periodic table.
Now let’s see the individual periodic trend with images and simple explanations.
#1 Valency trend in periodic table
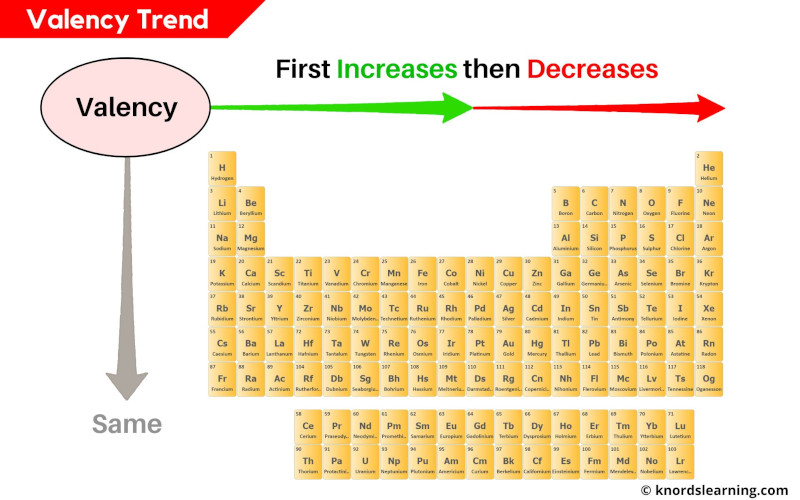
Valency trend
Across the period (from left to right): First Increases and then Decreases
Down the group (from top to bottom): Remains same
Explanation:
First of all, valency is the number of electrons which an atom gains or loses to form a stable octet.
This number first increases as we move across a period (from left to right) and then decreases in the same period.
If we move down the group (from top to bottom), then the number of electrons in outermost orbit remains the same only (see this periodic table labeled with valence electrons for more information). Hence the valency remains the same as we move down the group (from top to bottom).
#2 Atomic radius trend in periodic table
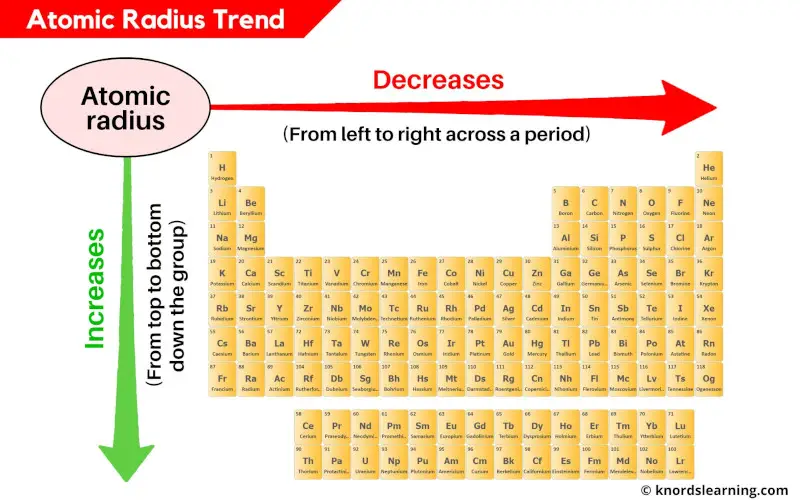
Atomic Radius Trend:
Across the period (from left to right): Decreases
Down the group (from top to bottom): Increases
The atomic radius (or atomic size) of the elements decreases as we move across a period (from left to right) and it increases as we move down in a group (from top to bottom).
For detailed explanation on atomic radius trends, visit the main article: Atomic radius trends in periodic table.
#3 Metallic character trend in periodic table
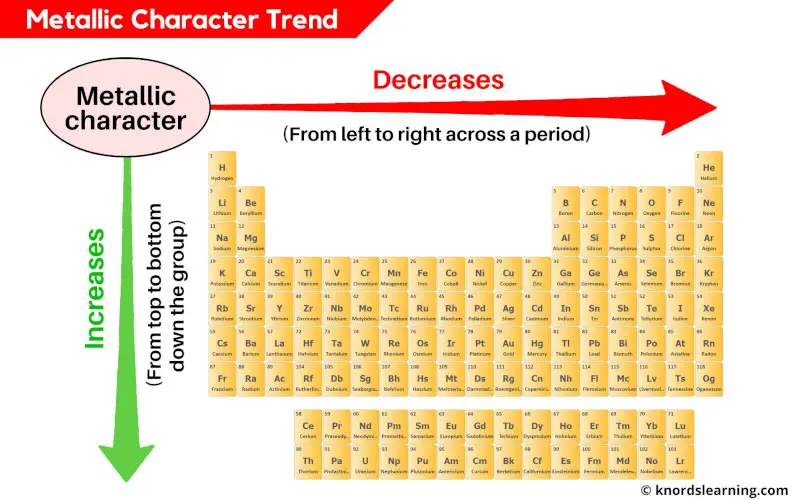
Metallic Character Trend:
Across the period (from left to right): Decreases
Down the group (from top to bottom): Increases
Explanation:
The metals are electron donors (that means they easily lose electron/s during a chemical reaction).
The nucleus of an atom has positively charged protons and the negatively charged electrons revolve around the nucleus.
There is a force of attraction between the positively charged nucleus and negatively charged electrons.
Now if the valence electron is close to the nucleus, then it remains more attracted towards the nucleus.
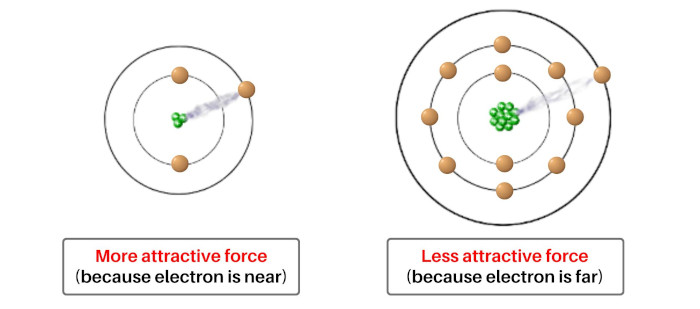
And if the valence electron is away from the nucleus, then it remains less attracted towards the nucleus.
And more attracted valence electrons are not lost easily, while the less attracted valence electrons are lost easily.
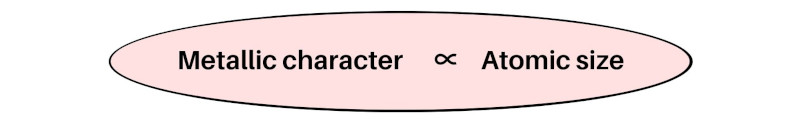
In other words, if the atomic size is bigger, then it will lose electrons easily and that is the property of metals. (Metals are electron donors or they lose electrons).
So as the atomic size increases, the loss of electrons becomes easy and so the metallic character increases.
Now, you have already seen the atomic size trends in the above section of this article.
As we move across the period (from left to right), the atomic size decreases, so the metallic character also decreases.
And similarly as we move down the group (from top to bottom), the atomic size increases, so the metallic character also increases.
#4 Non metallic character trend in periodic table

Non metallic Character Trend:
Across the period (from left to right): Increases
Down the group (from top to bottom): Decreases
Explanation:
Non metallic character trend is exactly opposite to the metallic character trend.
This is because the nonmetals have exactly the opposite properties than that of metals.
So they show exactly the opposite trend on periodic table.
#5 Electronegativity trend in periodic table

Electronegativity Trend:
Across the period (from left to right): Increases
Down the group (from top to bottom): Decreases
The electronegativity of elements increases as we move across a period (from left to right) and it decreases as we move down in a group (from top to bottom).
For detailed explanation on electronegativity trends, visit the main article: Electronegativity trends in periodic table.
#6 Electron affinity trend in periodic table
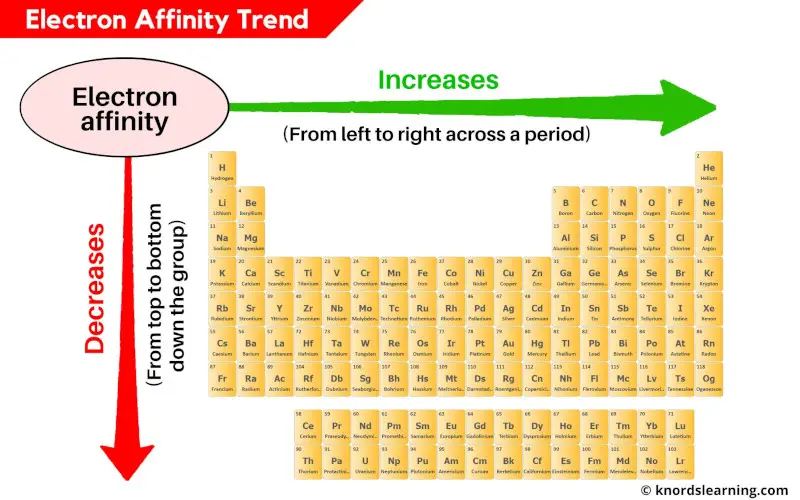
Electron Affinity Trend:
Across the period (from left to right): Increases
Down the group (from top to bottom): Decreases
The electron affinity of elements increases as we move across a period (from left to right) and it decreases as we move down in a group (from top to bottom).
For detailed explanation on electron affinity trends, visit the main article: Electron affinity trends in periodic table.
#7 Ionization energy trend in periodic table
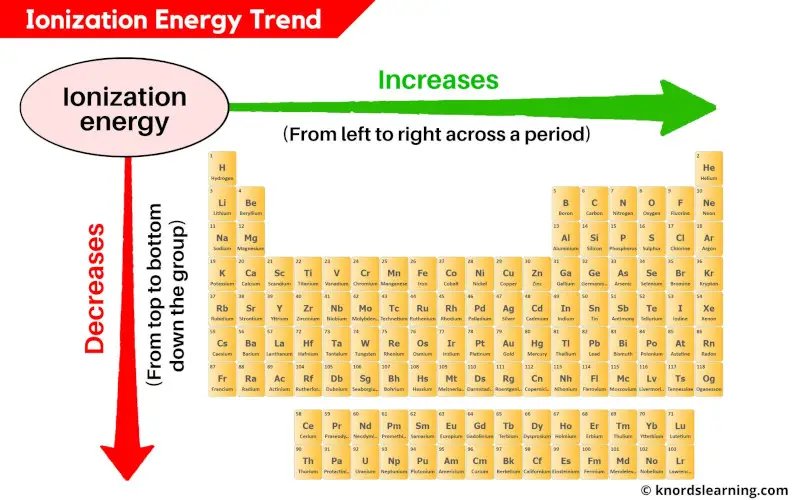
Ionization Energy Trend:
Across the period (from left to right): Increases
Down the group (from top to bottom): Decreases
The ionization energy of elements increases as we move across a period (from left to right) and it decreases as we move down in a group (from top to bottom).
For detailed explanation on ionization energy trends, visit the main article: Ionization energy trends in periodic table.
External resources:
- McCord, P. (n.d.). Periodic Table Trends. Periodic Table Trends. https://mccord.cm.utexas.edu/chembook/page.php?chnum=3§=10
- Boudreaux, K. A. (n.d.). The Parts of the Periodic Table. The Parts of the Periodic Table. https://www.angelo.edu/faculty/kboudrea/periodic/trends_summary.htm
- Periodic Table: Trends. (n.d.). Periodic Table: Trends. https://www.rsc.org/periodic-table/trends
- Periodic trends – Wikipedia. (2022, July 2). Periodic Trends – Wikipedia. https://en.wikipedia.org/wiki/Periodic_trends
- Periodic Trends. (2013, October 2). Chemistry LibreTexts. https://chem.libretexts.org/Bookshelves/Inorganic_Chemistry/Supplemental_Modules_and_Websites_(Inorganic_Chemistry)/Descriptive_Chemistry/Periodic_Trends_of_Elemental_Properties/Periodic_Trends
- University of Alabama in Huntsville. https://www.uah.edu/images/administrative/student-success-center/resources/handouts/handouts_2019/periodic_trends.pdf
- Americal Chemical Society. https://www.acs.org/content/dam/acsorg/education/students/highschool/chemistryclubs/infographics/mastering-periodic-trends-infographic.pdf
Jay is an educator and has helped more than 100,000 students in their studies by providing simple and easy explanations on different science-related topics. With a desire to make learning accessible for everyone, he founded Knords Learning, an online learning platform that provides students with easily understandable explanations.
Read more about our Editorial process.